
- Hyperliquid is ranked first in on-chain derivatives volume, now exceeding Coinbase’s, as traders deploy capital for execution.
- Hyperliquid is known for higher capital efficiency and unified liquidity that enables scaling volume faster than centralized exchanges.
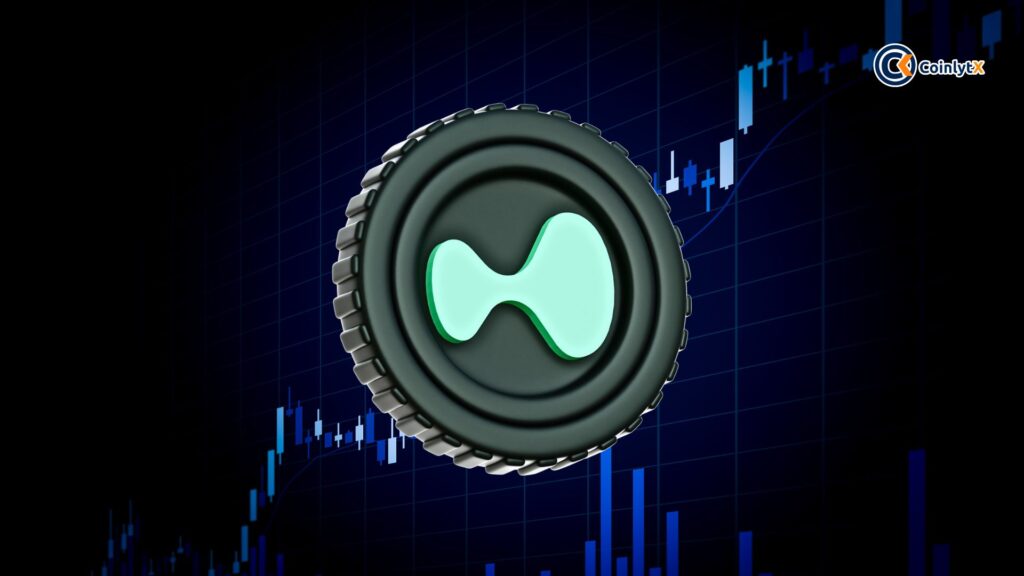
- Market pricing reflects growing confidence in crypto-native infrastructure that is bringing on-chain trading gains to institutional players.
Hyperliquid vs Coinbase data show Hyperliquid drawing massive real-time volume and user engagement. Hyperliquid’s 24-hour trading volume has surged above $11.7 billion, reflecting the growth of perp DEXs.
Meanwhile, Hyperliquid’s total ecosystem reported nearly $2.9 trillion in 2025 volume and millions of new users. Coinbase continues to handle large retail and institutional flows, but decentralized perpetual activity is rapidly rising across the market.
Trading Volume Signals a Structural Shift
Hyperliquid vs Coinbase comparisons now center on trading volume, the most reliable exchange performance metric. Hyperliquid has cleared $2.6 trillion in notional volume, surpassing Coinbase’s reported $1.4 trillion.
This gap reflects active capital deployment rather than passive account balances. Volume concentration matters because it measures execution confidence.
High volume indicates traders trust the venue during volatility, liquidations, and stress events. Hyperliquid’s figures suggest repeated institutional-scale usage rather than short-term testing by smaller participants.
Posts on X have pointed to the density of Hyperliquid’s volume. Unlike retail-heavy spot activity, its flow is dominated by leveraged derivatives.
Each dollar circulates faster, increasing liquidity depth and tightening spreads, which reinforces further participation.
Liquidity Density and Market Maker Behavior
Hyperliquid vs Coinbase differences become clearer when examining capital efficiency. Coinbase volume includes custodial transfers, compliance-limited trades, and fragmented regional products.
Hyperliquid’s activity reflects unified liquidity with rapid margin reuse across positions. This structure appeals to professional market makers.
Sustained derivatives volume requires confidence in engine reliability, liquidation logic, and uptime. Hyperliquid’s $2.6 trillion figure suggests liquidity providers have already committed meaningful balance sheet resources.
Several traders on X have noted improved execution quality during high-volatility sessions. Citing liquidity compounds, spreads compress, and slippage declines.
This strengthens the venue’s position without requiring marketing or incentive-driven volume spikes.
Market Pricing and Infrastructure Reassessment
Hyperliquid vs Coinbase performance also diverges in market pricing. Year-to-date data shows Hyperliquid rising 31.7 percent while Coinbase shares have fallen 27 percent.
The divergence reflects capital reallocation rather than broad risk sentiment. Price behavior suggests different valuation frameworks.
Coinbase trades as a mature intermediary facing margin constraints and regulatory limits. Hyperliquid trades as emerging infrastructure with expanding utility and uncertain upper bounds during price discovery phases.
Macro conditions reinforce this reassessment. On-chain systems now provide real-time transparency and composability.
As execution quality improves, centralized trust premiums narrow. The chart data reflects this transition quietly, through volume and price rather than narrative shifts.
Hyperliquid vs Coinbase is no longer a theoretical comparison; exchange competition is evolving. Measured flows, liquidity behavior, and pricing trends clearly indicate that.
Markets is adjusting toward crypto-native platforms built around on-chain execution.