
- SOL is trading within an ascending channel, with $95 acting as the critical breakout level.
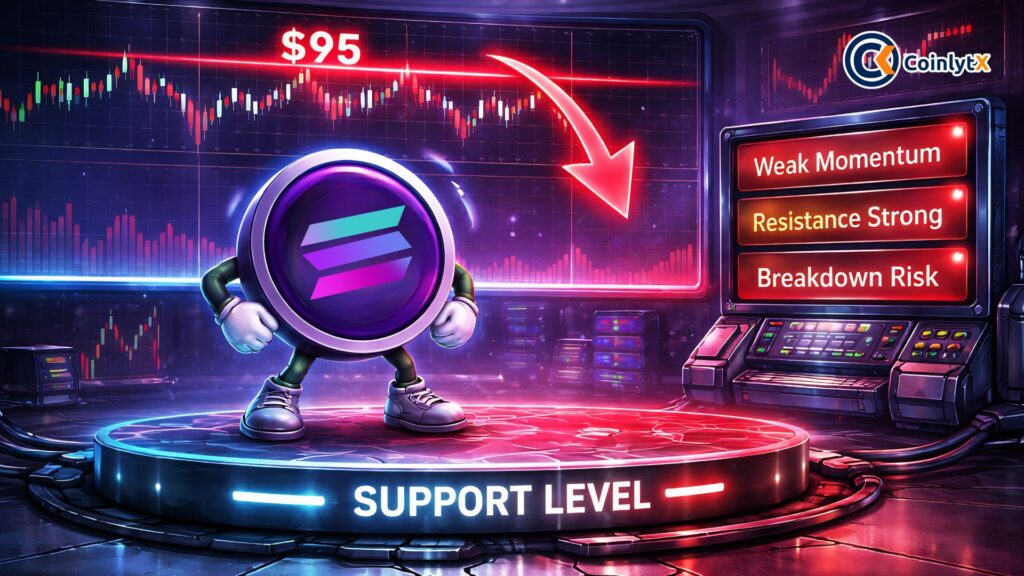
- Heavy short liquidation squeezes are reducing upside potential and increasing the risk of a pullback.
- A rejection near $95 could push SOL toward $87, while a breakout could push it above the $102 target.
Currently, SOL trades around $91 to $92, near the channel’s midpoint. This area acts as a dynamic equilibrium zone.
Price has repeatedly reacted here, confirming its technical importance. Ali Charts shared this observation on X, noting the channel’s reliability.
The tweet emphasized that market participants are trading within clear boundaries. This reinforces disciplined positioning rather than speculative breakout attempts.
The key resistance remains near $95, positioned toward the upper half of the channel. A confirmed breakout above this level requires strong volume.
A clean 4-hour close above resistance would validate bullish continuation.
Higher Timeframe Signals Maintain Bearish Context
On the 12-hour chart, Solana Price Analysis reflects a broader bearish structure. The asset previously declined sharply from the $140 to $150 supply zone.
Lower highs continue to define the prevailing trend. The current price stabilization near $90 to $93 appears corrective.
The $92.96 and $97.68 zone aligns with previous support that flipped into resistance just below the psychological $100 level.
Ali Charts pointed out that liquidity could be engineered above $97.68. A brief move above this level may trigger stop orders. However, a sharp rejection could follow, creating a bearish continuation setup.
If rejection occurs, downside targets include $87.00 and $80.26. Both levels have acted as demand zones previously. Only a sustained move above $97.68 would invalidate the bearish structure and shift the bias upward.
Liquidation Data Signals Reduced Upside Fuel
Solana Price Analysis incorporates liquidation metrics to assess positioning. On higher timeframes, short liquidations dominate significantly. The 12-hour data shows $2.40 million in shorts liquidated compared to minimal long liquidations.
This imbalance indicates that bearish traders have been squeezed. Such events typically drive price movement upward. However, they also reduce available short-side liquidity for further squeezes.
On lower timeframes, the trend remains consistent but weaker. The 4-hour data still shows higher short liquidations than longs. Meanwhile, the 1-hour data reveals a recent spike in short liquidations.
Ali Charts shared these figures on X, noting that immediate bearish liquidity has largely been cleared. The tweet suggested that continued upside requires fresh demand. Without new buyers, momentum may weaken.
As a result, the price may stall near resistance. With fewer shorts left to liquidate, upward pressure declines. This creates conditions for consolidation or a corrective pullback.
Traders now monitor $95 closely as the trigger level. A breakout targets $102 near the channel’s upper boundary. Failure at resistance shifts focus back to $87 support, maintaining a reaction-based approach.