

- Bitcoin ETF inflows surged reflects renewed institutional demand and reduced downside pressure.
- On-chain supply clusters show strong support near $66,000 and the next hurdle around $83,000.
- Technical charts strength support point for a sustained breakout above $71,500 toward higher liquidity zones.
Bitcoin ETF inflows for March show a positive shift. On-chain and technical data also show a transition from correction to re-accumulation as demand narrows all overhead supply.
Institutional Accumulation Signals a Market Pivot
Bitcoin ETF inflows accelerated sharply after a period of sustained outflows in early February. Last week recorded approximately $776 million in net additions.
The current week has already surpassed $789 million in accumulation. This change reflects a movement away from risk-off positioning toward directional exposure.

Source: X
Earlier outflows were more than 5,000 BTC, and they coincided with profit-taking caused by macroeconomic uncertainty. Price pressure followed as large holders reduced exposure.
A tweet shared by Glassnode described the shift as a reversal from distribution into accumulation. The magnitude of inflows now exceeds prior selling.
Such behavior aligns with improving liquidity and stabilization in spot demand. Bitcoin ETF inflows are historically linked to bullish price phases because they represent direct spot purchases.
These flows differ from leveraged futures activity that can unwind quickly. As a result, institutional demand provides structural support rather than short-term volatility.
Market psychology also changes when ETFs attract sustained capital. Investors begin using ETFs for exposure instead of hedging instruments.
This pattern supports a narrative of renewed conviction rather than defensive positioning.
On-Chain Supply Zones Define Support and Resistance
Bitcoin ETF inflows coincide with a relatively thin supply zone above current prices. The UTXO Realized Price Distribution chart maps where coins last moved on-chain.
This reveals that key psychological levels are between $66,000 and $69,000.
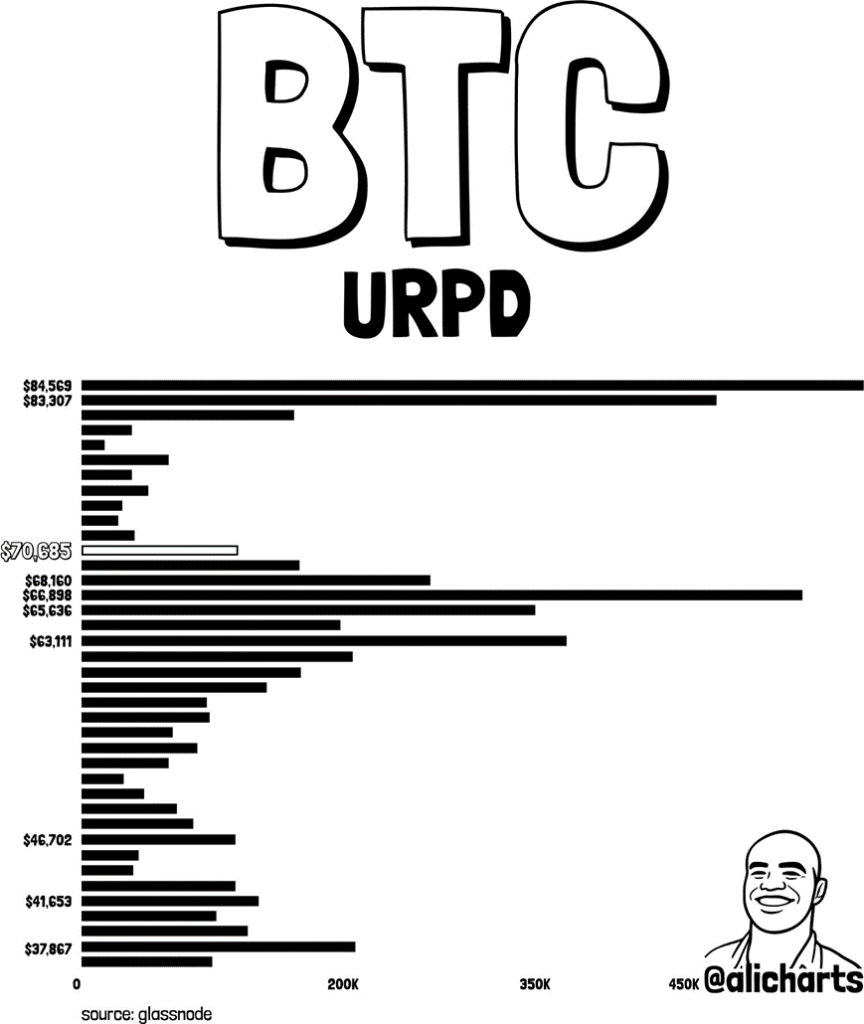
Source: X
A significant share of circulating Bitcoin was acquired in this range. Holders near breakeven tend to defend price during pullbacks, forming a structural demand zone.
Heavy cluster appears between $83,000 and $85,000; many Coins were transacted in this supply area.
Rallies into this band may meet selling pressure from investors seeking to exit at cost. Lower clusters are near $41,000 to $47,000 and $37,000 to $38,000, where earlier accumulation phases occurred.
These holders remain deeply profitable and show low spending behavior. Their positioning reinforces long-term macro support.
Bitcoin ETF inflows interacting with this distribution profile suggest a market balancing between strong demand and defined resistance.
Stability above $66,000 strengthens continuation potential. Failure to hold that level could reopen lower-volume zones.
Technical Structure Points to a Breakout Attempt
Bitcoin ETF inflows align with a technical structure that has shifted from consolidation into a breakout test.
Momentum appears impulsive instead of corrective. An hourly close above $71,527 would confirm a channel breakout.
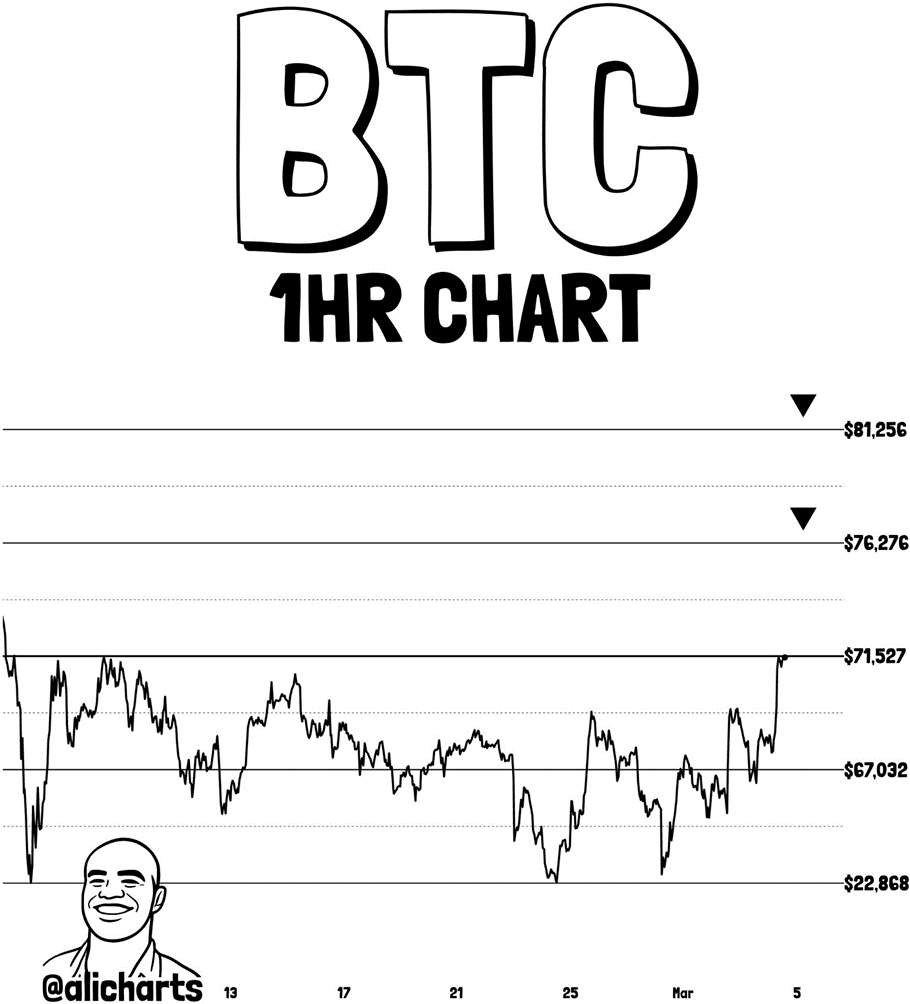
Source: X
Such acceptance could open a path toward $76,276 and then $81,256. These areas contain resting liquidity and profit-taking interest.
Failure to sustain levels above $71,500 would likely trigger mean reversion. The $67,000 zone now acts as the first defensive level for bulls.
This area coincides with on-chain support clusters. Bitcoin ETF inflows provide a backdrop of steady demand during this technical test. The interaction between spot accumulation and short-term price structure defines the next directional phase. Market behavior now reflects compression giving way to potential continuation